
It wasn’t only the ghost stories, carved pumpkins, and ghoulish get-up’s spooking people across the Metro Vancouver region last month, the local property market was too!
Inflation and rising interest rates have created ongoing caution for buyers and sellers, with home sale activity trending well below historical averages for October.
Andrew Lis, Director of Economics and Data Analysis at the Real Estate Board of Greater Vancouver (REBGV) commented on these trends saying, “Inflation and rising interest rates continue to dominate headlines, leading many buyers and sellers to assess how these factors impact their housing options. With sales remaining near historic lows, the number of active listings continues to inch upward, causing home prices to recede from the record highs set in the spring of 2022.”
Housing Market at a Glance
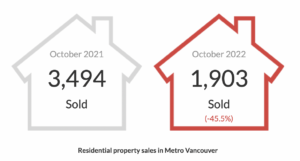
Last month, the REBGV reported that home sales in the region totalled 1,903. When compared to sales recorded in the same month one year ago, this figure has been very nearly halved (3,494 – down 45.5%). However, when looking back to one month prior in September, October’s residential sales had increased by 12.8%, rising from 1,687 homes sold.
Overall, last month’s sales fell by 33.3% below the 10-year October sales average.
Across Metro Vancouver, 4,033 detached, attached and apartment properties were newly listed for sale throughout October on the Multiple Listing Service® (MLS®) – a 0.4% dip down from the 4,049 homes listed in October 2021, and 4.6% lower than earlier this year in September, which saw 4,229 homes hit the local property market.
Looking at the total number of homes currently listed for sale across the region, buyers still have a decent property pool to compare and consider right now, with 9,852 homes live on the MLS® system. That’s 22.6% more than there was in October last year (8,034), but a little less (1.2%) than in September just been (9,971).
Lis, from the REBGV, goes on to add, “Recent years have been characterized by a frenetic pace of sales amplified by scarce listings on the market to choose from. Today’s market cycle is a marked departure, with a slower pace of sales and more selection to choose from. This environment provides buyers and sellers more time to conduct home inspections, strata minute reviews, and other due diligence. With the possibly of yet another rate hike by the Bank of Canada this December, it has become even more important to secure financing as early in the process as possible.”
Sales-to-Active Listings Ratio and Composite Benchmark Price
For all property types, the sales-to-active listings ratio this year for October was 19.3 %.
By property type, that ratio came out as:
Detached homes: 14.3%
Townhomes: 21.6%
Apartments: 23.2%
Generally, analysts say downward pressure on home prices occurs when the ratio dips below 12% for a sustained period, while home prices often experience upward pressure when it surpasses 20% over several months.
For all residential properties in Metro Vancouver, the MLS® Home Price Index composite benchmark this October was $1,148,900. A figure that has risen 2.1% from the same month a year ago, dropped by 9.2% over the last six months, and dipped by 0.6% in comparison to a couple of months back in September.
Metro Vancouver Home Sales by Property Type
Detached Homes
Sales of detached homes last month reached 575, a 47.2% decrease from the 1,090 detached sales recorded in October 2021. The benchmark price for a detached home is $1,892,100. This represents a 1.6% jump up from October last year and a 0.7% slip compared to September one month earlier.
Apartment Homes
Last month, sales of apartment homes reached 995 – that’s 44.8% less (nearly half) than the 1,801 sales one year earlier for the same period. The benchmark price of an apartment home is $727,100. This represents 5.1% more than October last year, but a 0.2% decrease compared to September just been.
Attached Homes
Attached home sales this October totalled 333. That’s again nearly half (44.8%), of the sales recorded back in October 2021 (603). The benchmark price of an attached unit is $1,043,600. This represents a 7.1% increase from October a year ago, and a 0.5% decrease compared to September earlier this year.
*Areas covered by the Real Estate Board of Greater Vancouver (REBGV): Burnaby, Coquitlam, Maple Ridge, New Westminster, North Vancouver, Pitt Meadows, Port Coquitlam, Port Moody, Richmond, South Delta, Squamish, Sunshine Coast, Vancouver, West Vancouver, and Whistler.